As educators, we all have the passion to ensure ALL our students are successful, but we also know that there are different needs across our student populations. Over the past few years, SEEC’s EL Coordinator Kerri Whipple and Data Specialist Chris Thompson have gathered data, developed a tool, and worked with the State Longitudinal Data System to create an app that can help you in your efforts to meet the needs of our English Learner student population.
If you’re asking yourself:
Is my student’s English language growth on track?
Is my student’s content performance on track?
These two resources will help to answer the questions: ACCESS Growth Charts and EL Norms App
Why is this important? Well, we know it’s important to ensure students are making progress, but it also helps you answer the question, “What should I expect for annual English language proficiency growth for my EL student?”
Plus there are a few requirements from the ND Department of Public Education that this will help you better understand and monitor. See below:
- In our ESSA accountability, set by DPI – the number of expected years to reach proficiency based on the ACCESS composite score
- ELs must grow and stay above their aim line to “count” in the ND Insights EL Growth report

ACCESS Growth Charts –
This EL Multi-Student monitoring template is intended to allow users to track individual and whole group student progress on the ACCESS for ELLs 2.0 Composite Assessment over time. Users have the opportunity to input students’ scores on the ACCESS assessment for each grade level they take the assessment and run a report for an individual student to monitor their progress over time.
Within this Excel spreadsheet you will enter your student level data including the names/IDs, baseline ACCESS test school year, and ACCESS Test scores and the rest will populate for you!
Within the spreadsheet as you enter more test scores, it will continue to update and auto-calculate:
- Expected # of years to achieve proficiency
- Expected grade to achieve proficiency
- Expected school year to achieve proficiency
- Student score at expected proficiency grade level

Using the “Student Level Data” tab on the tool, it can assess data from three different vantage points:
- Most recent assessment data
- Prior year assessment data (based on the school year selected)
- Selected year assessment data
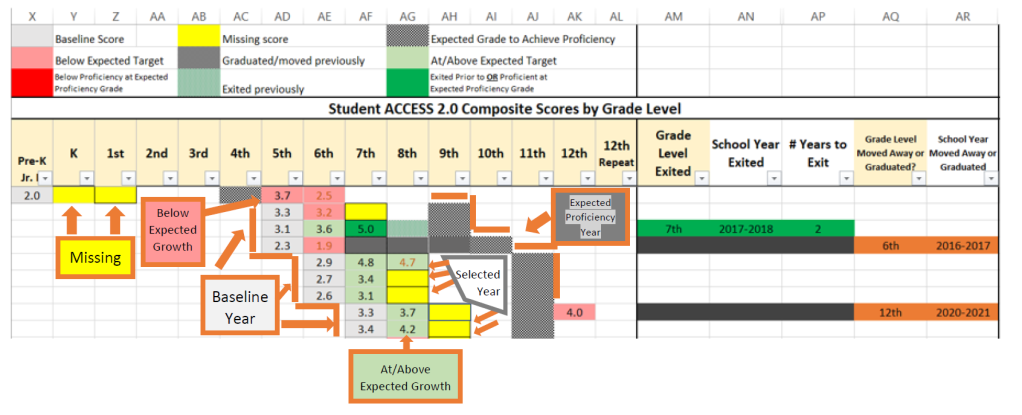
If student’s actual score is below their expected score is will show up red, at/above-green, if it is their baseline score-grey.
Need to see growth from prior year?
You will be able to see back in time to compare students’ growth from their prior school year – the colors will again show as noted above depending on their scores – or if they didn’t have a score a previous year then it would be yellow. Here is a quick image to show you what you could expect (note: each row represents an individual student):
Some additional overarching views that are formulated into the worksheet to auto-populate helpful reports include:
- The ability to view a grade-level breakdown of then number of students at or above target and below target levels, missing data, or exited/moved.
- Overall breakdown of the percentage of students at/above and below their expected target during the school year.
- Percentage and total number of students at/above expected target during the selected year by grade level.
- Grade level breakdown of the distribution of the total number of students within each ACCESS category.
- Distribution of the percentage of students within each ACCESS category by grade level.
See below an example graphical view.

EL ACCESS Norms App
This app will help you to understand what is a reasonable expectation for content performance for your EL student. The app is intended to provide users with information about the typical performance of EL students on the NWEA, STAR, ACT, and Aspire assessments by grade level at various points in the school year based on their level of English language proficiency.
Three major points to understand:
- Data comes from ND SLDS – ACCESS, MAP, STAR, ACT and Aspire (investigating Fastbridge)
- Compares EL content assessment (percentile rank or score) to other similar EL students with same grade and proficiency level.
- Tables/graphs can be used as a reference tool to show where EL students typically score on assessments based on their level of English proficiency
- Provides custom PDF reports (new feature) – users can enter in a specific student’s assessment percentile(s) to create a custom report comparing them with other Els of similar proficiency.
Students’ levels of English language proficiency are based on the scale scores that students receive on the ACCESS for ELLs 2.0 Assessment (developed by WIDA) which is administered during the spring of each school year. Scale scores are translated into the social construct of proficiency levels, which are based on grade level academic language expectations.
This application has taken data from all North Dakota students who have taken the ACCESS (administered through spring of 2016) and ACCESS 2.0 Assessment (from Spring 2017 to present) and created norms for the percentiles that students have received on each student achievement assessment (e.g. NWEA, STAR, ACT, and Aspire) at each grade level based on students’ levels of English proficiency.

These box and whisker plots are split into 5 quintiles (or groupings of 20% of students).
- 1st Quintile (left-whisker) represents the range of percentiles on the selected student achievement assessment (e.g. NWEA MAP, STAR, ACT, or Aspire) in which the lowest 20% of students scored who had received a specific ACCESS score during the previous grade level (or current grade level if “Same Spring” is selected).
- 2nd Quintile (yellow box) represents the range of percentiles of the 2nd lowest 20% of students on the selected student achievement assessment.
- 3rd Quintile (light green box) represents the range of percentiles of the middle 20% of students on the selected student achievement assessment.
- 4th Quintile (darker green box) represents the range of percentiles of the 2nd highest 20% of students on the selected student achievement assessment.
- 5th Quintile (right whisker) represents the range of percentiles of the highest 20% of students on the selected student achievement assessment.
For example: Using this application a teacher would be able to get a better picture of whether their student Johnny is performing at a level similar to other students who have taken the NWEA Math assessment that have the same level of English language proficiency as Johnny. After selecting the correct parameters (grade level ACCESS score, desired assessment period), Johnny’s fall NWEA math percentile is represented as the black dot on the graph below. Comparing his dot’s position within the box and whisker plot, he fell in the 1st Quintile which represents he was among the lowest 20% of other students at the same ACCESS score level who have taken the NWEA math at the same grade as Johnny.

Interested in being trained on these tools?
Kerri Whipple is conducting January training for multiple school and district teams in West Fargo. If you are interested in learning more and would like a training unique for your school, please reach out to Kerri.Whipple@k12.nd.us, and she can provide you more detailed information and access and how-to guides for these tools.
A Spring 2021 training will be scheduled after the revised date for ACCESS test scores to be released to schools is determined – this training will be open to anyone who would like to attend!

Leave a comment